
Page 61 - 07
P. 61
FTIR spectra were obtained on FTIR spectrometer. FTIR was used to gather in-
formation about the chemical structure of a compound and chemical modification after
plasma treatment. The FTIR images of the pristine and doped (untreated and plasma
treated) membranes are as shown in Fig. 5. Certain characteristic differences are
noticed at the peaks at certain wavelengths. These wavelengths were indicators of the
change in the chemical bonding and structure of the samples due to plasma treatment.
Fig. 5. FTIR spectra of pristine and Co nanocomposite polymer membrane both plasma treated
and untreated: a – pristine PMMA membrane; b – Co nanocomposite PMMA membrane;
c – plasma treated pristine PMMA membrane; d – plasma treated Co nanocomposite membrane.
–1
–1
–1
(1 – 3100…2850 cm characteristic of CH 3 ; 2 – C=O at 1770 cm ; 3 – 1125…1325 cm
–1
–1
characteristic of C–O–C; 4 – C–O at 1030 cm ; 5 – 765 cm Co NPs characteristic).
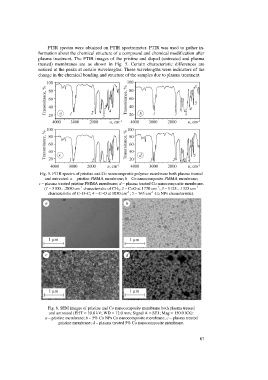
Fig. 6. SEM images of pristine and Co nanocomposite membrane both plasma treated
and untreated (EHT = 10.0 kV; WD = 12.0 mm; Signal A = SE1; Mag = 150.0 KX):
a – pristine membrane; b – 5% Co NPs Co nanocomposite membrane; c – plasma treated
pristine membrane; d – plasma treated 5% Co nanocomposite membrane.
67