
Page 60 - 07
P. 60
Morphology and particle size of Co NPs were also determined using transmission elec-
tron microscopy (TEM) Technika TEM instrument operating at 200 kV.
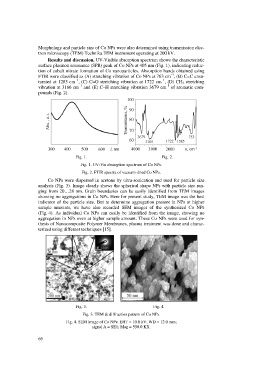
Results and discussion. UV-Visible absorption spectrum shows the characteristic
surface plasmon resonance (SPR) peak of Co NPs at 405 nm (Fig. 1), indicating reduc-
tion of cobalt nitrate formation of Co nanoparticles. Absorption bands obtained using
–1
FTIR were classified as (A) stretching vibration of Co NPs at 763 cm , (B) C=C unsa-
–1
–1
turated at 1285 cm , (C) C=O stretching vibration at 1722 cm , (D) CH 3 stretching
–1
–1
vibration at 3166 cm and (E) C–H stretching vibration 3679 cm of aromatic com-
pounds (Fig. 2).
Fig. 1. Fig. 2.
Fig. 1. UV-Vis absorption spectrum of Co NPs.
Fig. 2. FTIR spectra of vacuum dried Co NPs.
Co NPs were dispersed in acetone by ultra-sonication and used for particle size
analysis (Fig. 3). Image clearly shows the spherical shape NPs with particle size ran-
ging from 20…28 nm. Grain boundaries can be easily identified from TEM images
showing no aggregations in Co NPs. Here for present study, TEM image was the best
indicator of the particle size. But to determine aggregation present in NPs at higher
sample amounts, we have also recorded SEM images of the synthesized Co NPs
(Fig. 4). As individual Co NPs can easily be identified from the image, showing no
aggregation in NPs even at higher sample amount. These Co NPs were used for syn-
thesis of Nanocomposite Polymer Membranes, plasma treatment was done and charac-
terized using different techniques [15].
Fig. 3. Fig. 4.
Fig. 3. TEM & diffraction pattern of Co NPs.
Fig. 4. SEM image of Co NPs: EHT = 10.0 kV; WD = 12.0 mm;
signal A = SE1; Mag = 550.0 KX.
66