
Page 104 - Zmist-n3-2015-new
P. 104
The typical unloading events – “pop-out” and “elbow” were well investigated and
discussed in the literature [1, 12] and were found to be the result of the formation of
Si-III/Si-XII and a-Si phases respectively. The “kink pop-out” was shown to be related
to the formation of Si-III/Si-XII and in some cases to a mixture of Si-III/Si-XII and
a-Si and appeared more frequently for higher loads and slower unloading rates [13].
The reasons leading to the “kink pop-out” emergence with the increase of holding
time are not quite clear and have to be clarified. The magnified portions of P–h curves
containing the unloading events (Fig. 2) display the similarity of “kink pop-out” event
with “elbow” one, which is known to be responsible for the a-Si phase formation: both
of them demonstrate more gradual pushing out of the indenter caused by the growth of
material volume, comparatively with the “pop-out”, which represents a sharp, hopping
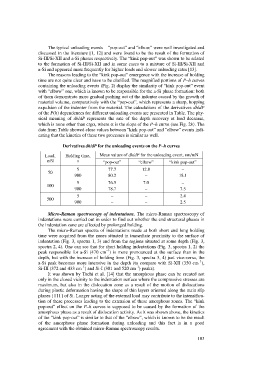
expulsion of the indenter from the material. The calculations of the derivatives dh/dP
of the P(h) dependences for different unloading events are presented in Table. The phy-
sical meaning of dh/dP represents the rate of the depth recovery at load decrease,
which is none other than ctga, where a is the slope of the P–h curve (see Fig. 2b). The
data from Table showed close values between “kink pop-out” and “elbow” events indi-
cating that the kinetics of these two processes is similar as well.
Derivatives dh/dP for the unloading events on the P–h curves
Load, Holding time, Mean values of dh/dP for the unloading event, nm/mN
mN s “pop-out” “elbow” “kink pop-out”
5 77.7 12.8 –
50
900 80.2 – 18.1
5 76.5 7.0 –
100
900 78.7 – 7.5
5 – – 2.4
500
900 – – 2.5
Micro-Raman spectroscopy of indentations. The micro-Raman spectroscopy of
indentations were carried out in order to find out whether the end structural phases in
the indentation zone are affected by prolonged holding.
The micro-Raman spectra of indentations made at both short and long holding
time were acquired from the zones situated in immediate proximity to the surface of
indentation (Fig. 3, spectra 1, 3) and from the regions situated at some depth (Fig. 3,
spectra 2, 4). One can see that for short holding indentations (Fig. 3, spectra 1, 2) the
–1
peak responsible for a-Si (470 cm ) is more pronounced at the surface than in the
depth, but with the increase of holding time (Fig. 3, spectra 3, 4) just vice-versa, the
–1
a-Si peak becomes more intensive in the depth (to compare with Si-XII (350 cm ),
–1 –1
Si-III (372 and 433 cm ) and Si-I (301 and 520 cm ) peaks).
It was shown by Tachi et al. [14] that the amorphous phase can be created not
only in the closed vicinity to the indentation surface where the compressive stresses are
maximum, but also in the dislocation zone as a result of the motion of dislocations
during plastic deformation having the shape of thin layers oriented along the main slip
planes {111} of Si. Longer acting of the external load may contribute to the intensifica-
tion of these processes leading to the extension of these amorphous zones. The “kink
pop-out” effect on the P–h curves is supposed to be caused by the formation of the
amorphous phase as a result of dislocation activity. As it was shown above, the kinetics
of the “kink pop-out” is similar to that of the “elbow”, which is known to be the result
of the amorphous phase formation during unloading and this fact is in a good
agreement with the obtained micro-Raman spectroscopy results.
103