
Page 105 - Zmist-n3-2015-new
P. 105
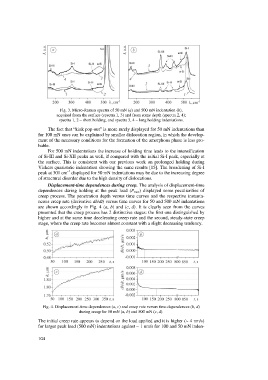
Fig. 3. Micro-Raman spectra of 50 mN (a) and 500 mN indentation (b),
                          acquired from the surface (spectra 1, 3) and from some depth (spectra 2, 4);
                           spectra 1, 2 – short holding, and spectra 3, 4 – long holding indentations.
                      The fact that “kink pop-out” is more rarely displayed for 50 mN indentations than
                  for 100 mN ones can be explained by smaller dislocation region, in which the develop-
                  ment of the necessary conditions for the formation of the amorphous phase is less pro-
                  bable.
                      For 500 mN indentations the increase of holding time leads to the intensification
                  of Si-III and Si-XII peaks as well, if compared with the initial Si-I peak, especially at
                  the  surface.  This  is  consistent  with  our  previous  work  on  prolonged  holding  during
                  Vickers quasistatic indentation showing the same results [15]. The broadening of Si-I
                               –1
                  peak at 301 cm  displayed for 50 mN indentations may be due to the increasing degree
                  of structural disorder due to the high density of dislocations.
                      Displacement-time dependences during creep. The analysis of displacement-time
                  dependences  during  holding  at  the  peak  load  (P max)  displayed  some  peculiarities  of
                  creep process. The penetration depth versus time curves and the respective instanta-
                  neous creep rate (derivative dh/dt) versus time curves for 50 and 500 mN indentations
                  are shown accordingly in Fig. 4 (a, b) and (c, d). It is clearly seen from the curves
                  presented that the creep process has 2 distinctive stages: the first one distinguished by
                  higher and at the same time decelerating creep rate and the second, steady-state creep
                  stage, where the creep rate becomes almost constant with a slight decreasing tendency.


                    Fig. 4. Displacement-time dependences (a, c) and creep rate versus time dependences (b, d)
                                    during creep for 50 mN (a, b) and 500 mN (c, d).
                  The initial creep rate appears to depend on the load applied and it is higher (~ 4 nm/s)
                  for larger peak load (500 mN) indentations against ~ 1 nm/s for 100 and 50 mN inden-

                  104