
Page 141 - Zmist-n4-2015
P. 141
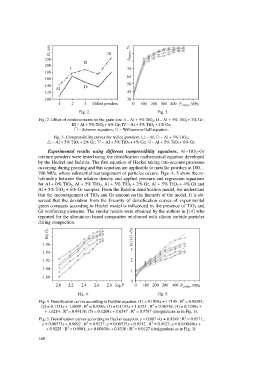
Fig. 2. Fig. 3.
Fig. 2. Effect of reinforcements on the grain size. I – Al + 5% TiO 2 ; II – Al + 5% TiO 2 + 2% Gr;
III – Al + 5% TiO 2 + 6% Gr; IV – Al + 5% TiO 2 + 4% Gr;
– Scherrer equation; – Williamson-Hall equation.
Fig. 3. Compressibility curves for milled powders. – Al; – Al + 5% TiO 2 ;
– Al + 5% TiO 2 + 2% Gr; – Al + 5% TiO 2 + 4% Gr; – Al + 5% TiO 2 + 6% Gr.
Experimental results using different compressibility equations. Al–TiO 2–Gr
mixture powders were tested using the densification mathematical equation developed
by the Heckel and Balshin. The first equation of Heckel taking into account processes
occurring during pressing and this equation are applicable to metallic powders at 100…
700 MPa, where substantial rearrangement of particles occurs. Figs. 4, 5 show the re-
lationship between the relative density and applied pressure and regression equations
for Al + 0% TiO 2, Al + 5% TiO 2, Al + 5% TiO 2 + 2% Gr, Al + 5% TiO 2 + 4% Gr and
Al + 5% TiO 2 + 6% Gr samples. From the Balshin densification model, we understand
that the encouragement of TiO 2 and Gr amount on the linearity of the model. It is ob-
served that the deviation from the linearity of densification curves of experimental
green compacts according in Heckel model is influenced by the presence of TiO 2 and
Gr reinforcing elements. The similar results were obtained by the authors in [14] who
reported for the aluminium based composites reinforced with silicon carbide particles
during compaction.
Fig. 4. Fig. 5.
2
Fig. 4. Densification curves according to Balshin equation. (1) = 0.1058x + 1.7145 : R = 0.96385;
2
2
(2) = 0.1131x + 1.6889 : R = 0.9586; (3) = 0.1183x + 1.6723 : R = 0.96536; (4) = 0.1298x +
2
2
+ 1.6214 : R = 0.99138; (5) = 0.1208x + 1.6547 : R = 0.9787 (designations as in Fig. 3).
2
Fig. 5. Densification curves according to Heckel equation. y = 0.00714x + 0.9249 : R = 0.9571;
2
2
y = 0.00573x + 0.9692 : R = 0.9237; y = 0.00535x + 0.9552 : R = 0.9127; y = 0.0.00446x +
2
2
+ 0.9225 : R = 0.9001; y = 0.00406x + 0.8338 : R = 0.9127 (designations as in Fig. 3).
140