
Page 142 - Zmist-n4-2015
P. 142
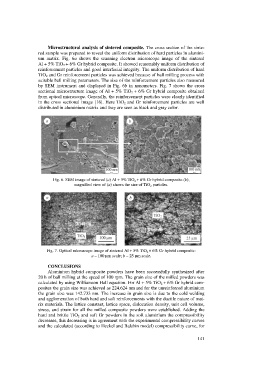
Microstructural analysis of sintered composite. The cross section of the sinte-
                  red sample was prepared to reveal the uniform distribution of hard particles in alumini-
                  um  matrix.  Fig.  6a  shows  the  scanning  electron  microscope  image  of  the  sintered
                  Al + 5% TiO 2 + 6% Gr hybrid composite. It showed reasonably uniform distribution of
                  reinforcement particles and good interfacial integrity. The uniform distribution of hard
                  TiO 2 and Gr reinforcement particles was achieved because of ball milling process with
                  suitable ball milling parameters. The size of the reinforcement particles also measured
                  by SEM instrument and displayed in  Fig. 6b in nanometers.  Fig. 7 shows the cross
                  sectional microstructure image of Al + 5% TiO 2  + 6% Gr hybrid composite obtained
                  from optical microscope. Generally, the reinforcement particles were clearly identified
                  in the cross sectional image [16]. Here TiO 2 and Gr reinforcement particles are well
                  distributed in aluminium matrix and they are seen as black and gray color.


                         Fig. 6. SEM image of sintered (a) Al + 5% TiO 2  + 6% Gr hybrid composite (b),
                                  magnified view of (a) shows the size of TiO 2  particles.


                      Fig. 7. Optical microscope image of sintered Al + 5% TiO 2  + 6% Gr hybrid composite:
                                          a – 100 mm scale; b – 25 mm scale.

                      CONCLUSIONS
                      Aluminium hybrid composite powders have been successfully synthesized after
                  20 h of ball milling at the speed of 100 rpm. The grain size of the milled powders was
                  calculated by using Williamson Hall equation. For Al + 5% TiO 2 + 6% Gr hybrid com-
                  posites the grain size was achieved as 224.624 nm and for the unreinforced aluminium
                  the grain size was 142.733 nm. The increase in grain size is due to the cold welding
                  and agglomeration of both hard and soft reinforcements with the ductile nature of mat-
                  rix materials. The lattice constant, lattice space, dislocation density, unit cell volume,
                  stress, and strain for all the milled composite powders were established. Adding the
                  hard and brittle TiO 2 and soft Gr powders in the soft aluminium the compressibility
                  decreases, this decreasing is in agreement with the experimental compressibility curves
                  and the calculated (according to Heckel and Balshin model) compressibility curve, for

                                                                                         141