
Page 39 - Zmist-n2-2015
P. 39
carried out to study three variables at three levels. The number of columns of an array
represents the maximum number of parameters that can be studied using that array.
The plan of experiments comprises 9 tests,
Table 2. Process parameter where the second column is assigned to the
values at three levels rotational speed, the third column is assigned to
welding speed and the third column is assigned
A, B, C, to axial force. The factors and assigned levels
Level
rpm mm/min kN are presented in Table 2. By conducting trail
1 1200 25 2 experiments the factors values were determined.
If rotational speed was lower than 1200 rpm,
2 1400 50 4
the weld nugget was observed and it produced
3 1600 75 6 insufficient heat generation and insufficient
metal transportation. When the rotational speed
was higher than 1600 rpm, a tunnel defect was observed and it caused turbulence.
Similarly, when the welding speed was lower than 25 mm/min, a pinhole type of the
defect occurred. For the welding speed higher than 75 mm/min, the insufficient heat
was generated thus giving the inadequate flow of the material. When the axial force
was lower than 2 kN, a tunnel and crack like defect occurred at the middle of the weld
cross section. If the force increased above 8 kN, large mass of flash and excessive
thinning were observed due to a higher heat input. The ranges of process parameters
selected are presented in Table 2.
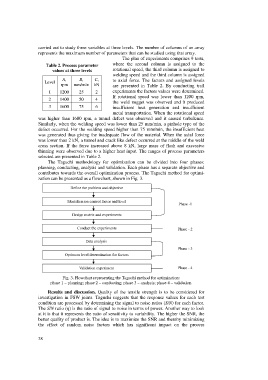
The Taguchi methodology for optimization can be divided into four phases:
planning, conducting, analysis and validation. Each phase has a separate objective and
contributes towards the overall optimization process. The Taguchi method for optimi-
zation can be presented as a flowchart, shown in Fig. 3.
Fig. 3. Flowchart representing the Taguchi method for optimization:
phase 1 – planning; phase 2 – conducting; phase 3 – analysis; phase 4 – validation.
Results and discussion. Quality of the tensile strength is to be considered for
investigation in FSW joints. Taguchi suggests that the response values for each test
condition are processed by determining the signal to noise ratios (S/N) for each factor.
The S/N ratio (η) is the ratio of signal to noise in terms of power. Another way to look
at it is that it represents the ratio of sensitivity to variability. The higher the SNR, the
better quality of product is. The idea is to maximize the SNR and thereby minimizing
the effect of random noise factors which has significant impact on the process
38