
Page 41 - Zmist-n2-2015
P. 41
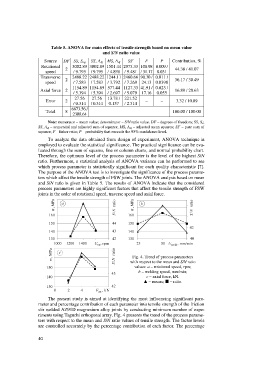
Table 5. ANOVA for main effects of tensile strength based on mean value
                                               and S/N ratio value
                     Source   DF  SS, S eq   SS, A dj   MS, A dj    SS¢   F   P   Contribution, %
                   Rotational    3002.89  3002.89  1501.44  2975.33  108.98  0.009 /
                              2                                                44.38 / 41.07
                     speed        / 9.795  / 9.795  / 4.898  / 9.481  / 31.17  0.031
                   Transverse    2488.22  2488.22  1244.11  2460.66  90.30 /  0.011 /
                              2                                                36.17 / 30.49
                     speed        / 7.583  / 7.583  / 3.792  / 7.269  24.13  0.0398
                                 1154.89  1154.89  577.44  1127.33  41.91 /  0.023 /
                   Axial force  2                                              16.89 / 20.63
                                  / 5.394  / 5.394  / 2.697  / 5.079  17.16  0.055
                                  27.56    27.56   13.78 /  221.52
                     Error    2                                   –     –      3.32 / 10.89
                                  / 0.314  / 0.314   0.157  / 2.514
                                 6673.56 /
                     Total    8                                               100.00 / 100.00
                                 2308.64
                      Note: numerator – mean value; denominator – S/N ratio value. DF – degrees of freedom; SS, S e ;
                  SS, A dj  – sequential and adjusted sum of squares; MS, A dj  – adjusted mean squares; SS¢ – pure sum of
                  squares; F – fisher ratio; P – probability that exceeds the 95% confidence level.
                      To analyze the data obtained from design of experiment, ANOVA technique is
                  employed to evaluate the statistical significance. The practical significance can be eva-
                  luated through the sum of squares, line or column charts, and normal probability chart.
                  Therefore, the optimum level of the process parameter is the level of the highest S/N
                  ratio. Furthermore, a statistical analysis of ANOVA variance can be performed to see
                  which process parameter is statistically significant for each quality characteristic [7].
                  The purpose of the ANOVA test is to investigate the significance of the process parame-
                  ters which affect the tensile strength of FSW joints. The ANOVA analysis based on mean
                  and S/N ratio is given in Table 5. The results of ANOVA indicate that the considered
                  process parameters are highly significant factors that affect the tensile strength of FSW
                  joints in the order of rotational speed, traverse speed and axial force.


                                                            Fig. 4. Trend of process parameters
                                                           with respect to the mean and S/N ratio
                                                             values: a – rotational speed, rpm;
                                                              b – welding speed, mm/min;
                                                                  c – axial force, kN.
                                                                 ▲ – means;  – ratio.

                      The present study is aimed at identifying the most influencing significant para-
                  meter and percentage contribution of each parameter into tensile strength of the friction
                  stir welded AZ91D magnesium alloy joints by conducting minimum number of expe-
                  riments using Taguchi orthogonal array. Fig. 4 presents the trend of the process parame-
                  ters with respect to the mean and S/N ratio values of tensile strength. The factor levels
                  are controlled accurately by the percentage contribution of each factor. The percentage

                  40