
Page 40 - Zmist-n2-2015
P. 40
performance. Therefore, the method of calculating the S/N ratio depends on whether
the quality characteristic is smaller-the-better, larger-the-better, or nominal-the-best.
We adopt the “Smaller is better” approach. The S/N ratio for this type of response was
used by employing formula,
S 1 2
= - 10log ∑ Y ijk , (1)
N n
where n is the number of tests and Y ijk is the experimental value of the i th quality
characteristic in the j th experiment at the k th test [7].
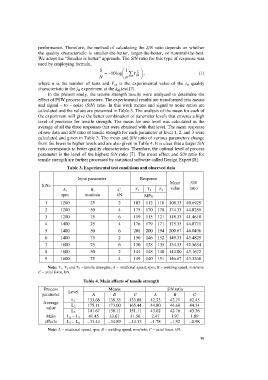
In the present study, the tensile strength results were analyzed to determine the
effect of FSW process parameters. The experimental results are transformed into means
and signal – to – noise (S/N) ratio. In this work means and signal to noise ratios are
calculated and the values are presented in Table 3. The analysis of the mean for each of
the experiment will give the better combination of parameter levels that ensures a high
level of precision for tensile strength. The mean for one level was calculated as the
average of all the three responses that were obtained with that level. The mean response
of raw data and S/N ratio of tensile strength for each parameter at level 1, 2, and 3 were
calculated and given in Table 3. The mean and S/N ratio of various parameters change
from the lower to higher levels and are also given in Table 4. It is clear that a larger S/N
ratio corresponds to better quality characteristics. Therefore, the optimal level of process
parameter is the level of the highest S/N ratio [7]. The mean effect and S/N ratio for
tensile strength are further processed by statistical software called Design Expert [8].
Table 3. Experimental test conditions and observed data
Input parameter Response
Mean S/N
S.No
A, B, C, T 1 T 2 T 3 value ratio
rpm mm/min kN MPa
1 1200 25 2 103 112 110 108.33 40.6925
2 1200 50 4 175 170 178 174.33 44.8259
3 1200 75 6 119 115 121 118.33 41.4618
4 1400 25 4 176 179 171 175.33 44.8771
5 1400 50 6 208 200 194 200.67 46.0496
6 1400 75 2 150 146 152 149.33 43.4829
7 1600 25 6 130 138 135 134.33 42.5634
8 1600 50 2 144 148 140 144.00 43.1672
9 1600 75 4 149 140 151 146.67 43.3268
Note: T 1 , T 2 and T 3 – tensile strengths; A – rotational speed, rpm; B – welding speed, mm/min;
C – axial force, kN.
Table 4. Main effects of tensile strength
Process Level Means S/N ratio
parameter A B C A B C
L 1 133.66 139.33 133.88 42.33 42.71 42.45
Average
value L 2 175.11 173.00 165.44 44.80 44.68 44.34
L 3 141.67 138.11 151.11 43.02 42.76 43.36
Main L 2 – L 1 41.45 33.67 31.56 2.47 1.97 1.89
effects L 3 – L 2 –33.44 –34.89 –14.33 –1.78 –1.92 –0.98
Note: A – rotational speed, rpm; B – welding speed, mm/min; C – axial force, kN.
39