
Page 58 - Zmist-n2-2015
P. 58
*
De e s f * * De p * * *
log = log + b log2N , log = log e + log2N ,
c
f
f
f
2 E 2
*
*
where s f , e f – coefficients in dependence which defines crack initiation in porous
*
*
material; b , c – exponents in this dependence.
*
It should be noted that the value of N f was found from the point of intersection of
two approximating straight lines. The dependence of the maximum axial stress in a
load cycle on the number of load cycles assuming that the first of these lines describes
approximately a constant value of these stresses. The results of the calculation para-
* *
meters e f 0, c 0, e f and c and for different porosity, using the least squares, is presented
in Table 2.
Table 2. The parameters values according to the Manson–Coffin for crack initiation
curve and fatigue life (up to the total fracture of the samples)
of the sinters 316L stainless steel
Fracture curve Crack initiation curve
Porosity p, % 2 * 2
*
c e f R c e f R
41 0.5055 0.000108 0.9950 0.4964 0.000057 0.9740
33 0.4934 0.000163 0.9908 0.4730 0.000158 0.9935
26 0.5126 0.000194 0.9912 0.4968 0.000181 0.9803
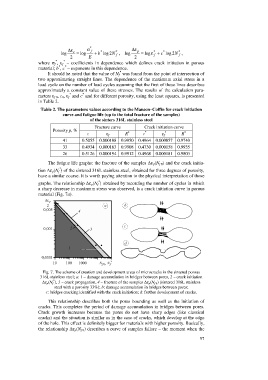
The fatigue life graphs: the fracture of the samples ∆e p(N f 0) and the crack initia-
*
tion ∆e p(N f ) of the sintered 316L stainless steel, obtained for three degrees of porosity,
have a similar course. It is worth paying attention to the physical interpretation of those
*
graphs. The relationship ∆e p(N f ) obtained by recording the number of cycles in which
a sharp decrease in maximum stress was observed, is a crack initiation curve in porous
material (Fig. 7a).
Fig. 7. The scheme of creation and development areas of microcracks in the sintered porous
316L stainless steel; a: 1 – damage accumulation in bridges between pores, 2 – crack initiation
*
∆e p (N f ), 3 – crack propagation, 4 – fracture of the samples ∆e p (N f 0 ) (sintered 316L stainless
steel with a porosity 33%); b: damage accumulation in bridges between pores;
c: bridges cracking identified with the crack initiation; d: further development of cracks.
This relationship describes both the pores bounding as well as the initiation of
cracks. This completes the period of damage accumulation in bridges between pores.
Crack growth increases because the pores do not have sharp edges (like classical
cracks) and the situation is similar as in the case of cracks, which develop at the edge
of the hole. This effect is definitely bigger for materials with higher porosity. Basically,
the relationship ∆e p(N f 0) describes a curve of samples failure – the moment when the
57