
Page 55 - Zmist-n2-2015
P. 55
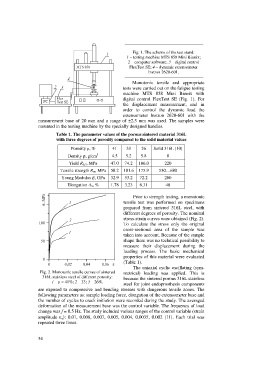
Fig. 1. The scheme of the test stand:
                                                         1 – testing machine MTS 858 Mini Bionix;
                                                          2 – computer software; 3 – digital control
                                                          FlexTest SE; 4 – dynamic extensometer
                                                                   Instron 2620-601.

                                                            Monotonic  tensile  and  appropriate
                                                        tests were carried out on the fatigue testing
                                                        machine  MTS  858  Mini  Bionix  with
                                                        digital  control  FlexTest  SE  (Fig.  1).  For
                                                        the  displacement  measurement,  and  in
                                                        order  to  control  the  dynamic  load  the

                                                        extensometer  Instron  2620-601  with  the
                  measurement base of 20 mm and a range of ±2.5 mm was used. The samples were
                  mounted in the testing machine by the specially designed handles.

                          Table 1. The parameter values of the porous sintered material 316L
                          with three degrees of porosity compared to the solid material values

                                 Porosity p, %     41    33     26   Solid 316L [10]
                                            3
                               Density r, g/cm     4.5   5.2    5.8        8
                                Yield R 0,2 , MPa   47.0   74.2   106.0   220
                            Tensile strength R m , MPa  58.2  101.6  175.9   530…680
                            Young Modulus E, GPa   32.9   53.2   72.2     200
                               Elongation A 5 , %   1.78   3.23   6.31     40

                                                            Prior to strength testing, a monotonic
                                                        tensile  test  was  performed  on  specimens
                                                        prepared  from  sintered  316L  steel,  with
                                                        different degrees of porosity. The nominal
                                                        stress-strain curves were obtained (Fig. 2).
                                                        To  calculate  the  stress  only  the  original
                                                        cross-sectional  area  of  the  sample  was
                                                        taken into account. Because of the sample
                                                        shape there was no technical possibility to
                                                        measure  their  displacement  during  the
                                                        loading  process.  The  basic  mechanical
                                                        properties of this material were evaluated
                                                        (Table 1).

                                                            The uniaxial cyclic oscillating (sym-
                   Fig. 2. Monotonic tensile curves of sintered   metrical)  loading  was  applied.  This  is
                    316L stainless steel of different porosity:    because the sintered porous 316L stainless
                        1 – p = 41%; 2 – 33; 3 – 26%.
                                                        steel for joint endoprosthesis components
                  are  exposed  to  compressive  and  bending  stresses  with  dangerous  tensile  zones.  The
                  following parameters as: sample loading force, elongation of the extensometer base and
                  the number of cycles to crack initiation were recorded during the study. The averaged
                  deformation of the measurement base was the control variable. The frequency of load
                  change was f = 0.5 Hz. The study included various ranges of the control variable (strain
                  amplitude  e a):  0.01,  0.008,  0.007,  0.005,  0.004,  0.0035,  0.002  [11].  Each  trial  was
                  repeated three times.


                  54