
Page 56 - Zmist-n2-2015
P. 56
The performed investigation made it
possible to obtain plots of fatigue life.
They showed the dependence of the de-
formation amplitude e a on the number of
cycles N f 0 to complete fracture of the
specimen. The comparison of the fatigue
life graphs for the three degrees of poro-
sity shows that with the increase in poro-
sity the fatigue life measured by the num-
ber of cycles until complete failure de-
creases about three times for a total
assumed load range (Fig. 3).
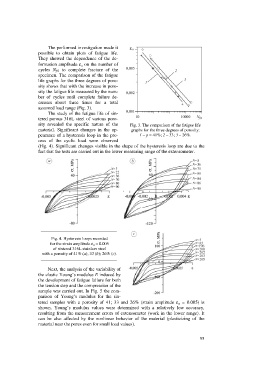
The study of the fatigue life of sin-
tered porous 316L steel of various poro-
sity revealed the specific nature of the Fig. 3. The comparison of the fatigue life
material. Significant changes in the ap- graphs for the three degrees of porosity:
pearance of a hysteresis loop in the pro- 1 – p = 41%; 2 – 33; 3 – 26%.
cess of the cyclic load were observed
(Fig. 4). Significant changes visible in the shape of the hysteresis loop are due to the
fact that the tests are carried out in the lower measuring range of the extensometer.
Fig. 4. Hysteresis loops recorded
for the strain amplitude e a = 0.005
of sintered 316L stainless steel
with a porosity of 41% (a); 33 (b); 26% (c).
Next, the analysis of the variability of
the elastic Young’s modulus E induced by
the development of fatigue failure for both
the tension step and the compression of the
sample was carried out. In Fig. 5 the com-
parison of Young’s modulus for the sin-
tered samples with a porosity of 41; 33 and 26% (strain amplitude e a = 0.005) is
shown. Young’s modulus values were determined with a relatively low accuracy,
resulting from the measurement errors of extensometer (work in the lower range). It
can be also affected by the nonlinear behavior of the material (plasticizing of the
material near the pores even for small load values).
55