
Page 57 - Zmist-n2-2015
P. 57
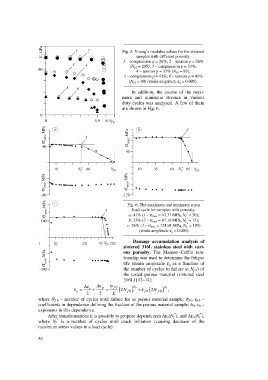
Fig. 5. Young’s modulus values for the sintered
                                                             samples with different porosity:
                                                        1 – compression p = 26%; 2 – tension p = 26%
                                                           (N f 0  = 205); 3 – compression p = 33%;
                                                             4 – tension p = 33% (N f 0  = 93);
                                                        5 – compression p = 41%; 6 – tension p = 41%
                                                          (N f 0  = 90) (strain amplitude e a  = 0.005).

                                                           In  addition,  the  course  of  the  maxi-
                                                       mum  and  minimum  stresses  in  various
                                                       duty cycles was analyzed. A few of them
                                                       are shown in Fig. 6.


                                                          Fig. 6. The maximum and minimum stress
                                                            load cycle for samples with porosity:
                                                                                    *
                                                          a: 41% (1 – s max  = 43.37 MPa, N f  = 50);
                                                                                    *
                                                          b: 33% (2 – s max  = 87.16 MPa, N f  = 75);
                                                                                    *
                                                          c: 26% (3 – s max  = 124.91 MPa, N f  = 195)
                                                               (strain amplitude e a  = 0.005).
                                                            Damage  accumulation  analysis  of
                                                        sintered  316L  stainless  steel  with  vari-
                                                        ous  porosity.  The  Manson–Coffin  rela-
                                                        tionship was used to determine the fatigue
                                                        life  (strain  amplitude  e a  as  a  function  of
                                                        the number of cycles to failure at N f 0) of
                                                        the  tested  porous  material  (sintered  steel
                                                                                          316L) [12–14]:
                                      De e  De p   s 0      b 0           c 0
                                                   f
                                  e =      +      =   ( 2N  f  0  )  + e 2N  ) ,
                                   a
                                                                  0
                                                                 f
                                                                     ( 0f
                                       2     2     E
                  where N f  0 – number of cycles until failure for as porous material sample; s f 0, e f 0 –
                  coefficients in dependence defining the fracture of the porous material sample; b 0, c 0 –
                  exponents in this dependence.
                                                                              *           *
                      After transformations it is possibly to propose dependences ∆e e(N f ), and ∆e p(N f ),
                          *
                  where  N f   is  a  number  of  cycles  until  crack  initiation  (causing  decrease  of  the
                  maximum stress values in a load cycle):
                  56