
Page 73 - Zmist-n4-2015
P. 73
of the wires are shown in the Table. The hot rolled bar was marked E0 and the follo-
wing steels as E1…E7 according to a cold drawing step.
p
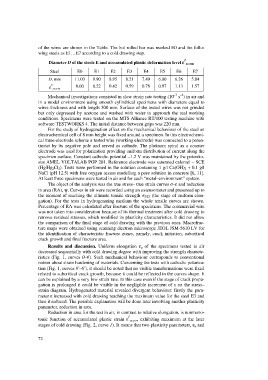
Diameter D of the steels E and accumulated plastic deformation level e ee accum
e
Steel E0 E1 E2 E3 E4 E5 E6 E7
D, mm 11.03 9.90 8.95 8.21 7.49 6.80 6.26 5.04
p
e accum 0.00 0.22 0.42 0.59 0.78 0.97 1.13 1.57
–1
–7
Mechanical investigations consisted in slow strain rate testing (10 s ) in air and
in a model environment using smooth cylindrical specimens with diameters equal to
wires thickness and with length 300 mm. Surface of the tested wires was not grinded
but only degreased by acetone and washed with water to approach the real working
conditions. Specimens were tested on the MTS Alliance RT/100 testing machine with
software TESTWORKS 4. The initial distance between grips was 220 mm.
For the study of hydrogenation effect on the mechanical behaviour of the steel an
electrochemical cell of 8 mm height was fixed around a specimen. In this electrochemi-
cal three-electrode scheme a tested wire (working electrode) was connected to a poten-
tiostat by its negative pole and served as cathode. The platinum spiral as a counter
electrode was used for polarization providing uniform distribution of current along the
specimen surface. Constant cathodic potential –1.2 V was maintained by the potentio-
stat AMEL VOLTALAB PGP 201. Reference electrode was saturated calomel – SCE
(Hg|Hg 2Cl 2). Tests were performed in the solution containing 1 g/l Ca(OH) 2 + 0.1 g/l
NaCl (pH 12.5) with free oxygen access modelling a pore solution in concrete [6, 11].
At least three specimens were tested in air and for each “metal–environment” system.
The object of the analysis was the true stress– true strain curves σ–e and reduction
in area (RA), y. Curves in air were recorded using an extensometer and presented up to
the moment of reaching the ultimate tensile strength σ UTS (the stage of uniform elon-
gation). For the tests in hydrogenating medium the whole tensile curves are shown.
Percentage of RA was calculated after fracture of the specimens. The commercial wire
was not taken into consideration because of its thermal treatment after cold drawing to
remove residual stresses, which modified its plasticity characteristics. It did not allow
the comparison of the final stage of cold drawing with the previous ones. Macrofrac-
ture maps were obtained using scanning electron microscope JEOL JSM-5610 LV for
the identification of characteristic fracture zones, namely, crack initiation, subcritical
crack growth and final fracture area.
Results and discussion. Uniform elongation e u of the specimens tested in air
decreased sequentially with cold drawing degree with improving the strength characte-
ristics (Fig. 1, curves 0–6). Such mechanical behaviour corresponds to conventional
notion about strain hardening of materials. Concerning the tests with cathodic polariza-
tion (Fig. 1, curves 0¢–6¢), it should be noted that no visible transformations were fixed
related to subcritical crack growth, because it could be reflected in the curves shape. It
can be explained by a very low strain rate. In this case even if the stage of crack propa-
gation is prolonged it could be visible in the negligible increment of ε on the stress–
strain diagram. Hydrogenated material revealed divergent behaviour: firstly the para-
meter e increased with cold drawing reaching the maximum value for the steel E3 and
then it reduced. The possible explanation will be done later involving another plasticity
parameter, reduction in area.
Reduction in area for the test in air, in contrast to relative elongation, is nonmono-
p
tonic function of accumulated plastic strain e accum exhibiting maximum at the later
stages of cold drawing (Fig. 2, curve 1). It means that two plasticity parameters, e u and
72