
Page 75 - Zmist-n4-2015
P. 75
tation of structural units, and from this point the following increment of plastic strain
only reduces the parameter y.
Considering the wires suffering hydrogenation it was easy to note that fracture in
all cases took place before reaching s UTS, obviously, due to rapid growth of a macro-
crack. Therefore it could be assumed that values of rupture stress and stress for crack
H
initiation were very close, the corresponding strain values e u being slightly less than
H
H
H
e . It could be accepted that e u = e to simplify the calculation. Then according to (1),
curve 4 in Fig. 2, demonstrating the resistance of the investigated steels to initiation of
hydrogen induced cracking, was obtained. The curve exhibited maximum in the middle
stage of cold drawing, caused by a combined action of two competitive effects. Some
retardation of crack initiation from the surface could be a result of reduced surface
roughness as a result of cold drawing. Meanwhile, susceptibility to hydrogen assisted
cracking prevails at the final stages because of considerable increment in steel strength.
Obviously, surface roughness doesn’t matter in the case of fracture in air, therefore the
parameter y u decreases sequentially with cold drawing degree (Fig. 2, curve 2). Con-
H
H
cerning the resistance to crack propagation under cathodic polarization y – y u (see
Fig. 2, curves 3 and 4), it should be noted that evolution of this parameter due to cold
drawing is similar in both experimental conditions (air and hydrogenation) – it rises
slightly at the later stages of cold drawing process. Another situation could be expected
for the final prestressing steel (which is not considered in the present work) due to its
extremely high strength and essential susceptibility to hydrogen embrittlement [7].
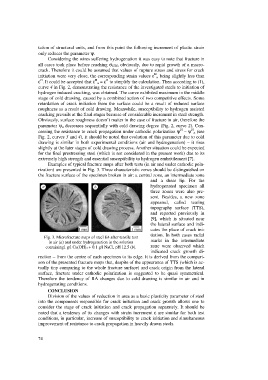
Examples of typical fracture maps after both tests (in air and under cathodic pola-
rization) are presented in Fig. 3. Three characteristic zones should be distinguished on
the fracture surface of the specimen broken in air: a central zone, an intermediate zone
and a shear lip. For the
hydrogenated specimen all
three zones were also pre-
sent. Besides, a new zone
appeared, called tearing
topography surface (TTS),
and reported previously in
[9], which is situated near
the lateral surface and indi-
cates the place of crack ini-
tiation. In both cases radial
Fig. 3. Microfracture maps of steel E4 after tensile test
marks in the intermediate
in air (a) and under hydrogenation in the solution
containing1 g/l Ca(OH) 2 + 0.1 g/l NaCl, pH 12.5 (b). zone were observed which
indicated crack growth di-
rection – from the centre of each specimen to its edge. It is derived from the compari-
son of the presented fracture maps that, despite of the appearance of TTS (which is ac-
tually tiny comparing to the whole fracture surface) and crack origin from the lateral
surface, fracture under cathodic polarization is suggested to be quasi symmetrical.
Therefore the tendency of RA changes due to cold drawing is similar in air and in
hydrogenating conditions.
CONCLUSION
Division of the values of reduction in area as a basic plasticity parameter of steel
into the components responsible for crack initiation and crack growth allows one to
consider the stage of crack initiation and crack propagation separately. It should be
noted that a tendency of its changes with strain increment e are similar for both test
conditions, in particular, increase of susceptibility to crack initiation and simultaneous
improvement of resistance to crack propagation in heavily drawn steels.
74