
Page 74 - Zmist-n4-2015
P. 74
y, the former showing uniform deformation, and the latter – general plasticity under
p
fracture, revealed opposite tendencies with e accum increment.
On the basis of the principle of volume constancy of a metal during its plastic
deformation, it is possible to calculate its RA at the moment of reaching the σ UTS value,
y u, using well-known relation [12]:
1
e = 2ln . (1)
1- y
Since e u used for calculation corresponds to the start of a neck formation because
of the crack nucleation inside a specimen, the obtained value y u could be considered as
an indirect indicator of steel resistance to crack initiation under tension. Values calcu-
lated for the tests in air are plotted in Fig. 2 as curve 2. Thus, these data actually repre-
sent the material resistance to crack initiation which is relatively low for the tested
steel.
Likewise the subtraction y – y u could characterise the stage of crack propagation
– the greater this value, the higher the plasticity margin of material. Thereby y u and
(y – y u) could be indicators of steel resistance to crack initiation and crack growth
correspondingly. Analysis of Fig. 2 (curves 1 and 2) reveals an opposite trend in the
changes of these values. Regularities at the stage of crack initiation correspond to the
expected results (e u decreases with cold drawing), while a positive effect of the steel
treatment on crack growth resistance could be found in the peculiarities of metal struc-
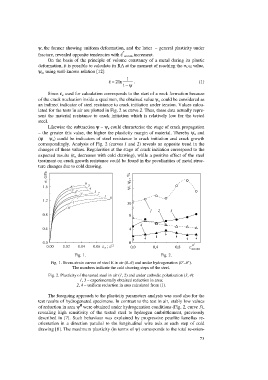
ture changes due to cold drawing.
Fig. 1. Fig. 2.
Fig. 1. Stress-strain curves of steel E in air (0–6) and under hydrogenation (0’–6’).
The numbers indicate the cold drawing steps of the steel.
Fig. 2. Plasticity of the tested steel in air (1, 2) and under cathodic polarization (3, 4):
1, 3 – experimentally obtained reduction in area;
2, 4 – uniform reduction in area calculated from (1).
The foregoing approach to the plasticity parameters analysis was used also for the
test results of hydrogenated specimens. In contrast to the test in air, stably low values
H
of reduction in area y were obtained under hydrogenation conditions (Fig. 2, curve 3),
revealing high sensitivity of the tested steel to hydrogen embrittlement, previously
described in [7]. Such behaviour was explained by progressive pearlite lamellas re-
orientation in a direction parallel to the longitudinal wire axis at each step of cold
drawing [8]. The maximum plasticity (in terms of y) corresponds to the total re-orien-
73